Overview
In the Main Dashboard you can view all your websites connected to Vantevo Analytics.
You can add a domain at any time by clicking add domain.
By clicking on domain view you see in the dashboard the complete overview of your website data.
Metrics are collected in the form of widgets, which show numerical metrics, tables and graphs. They relate to the selected time filter; next to each piece of data is a comparison with the previous period, shown as a percentage (%).
All sections are clickable and interactive.
Your website dashboard is organized into two main pages: Pages and Events.
Pages
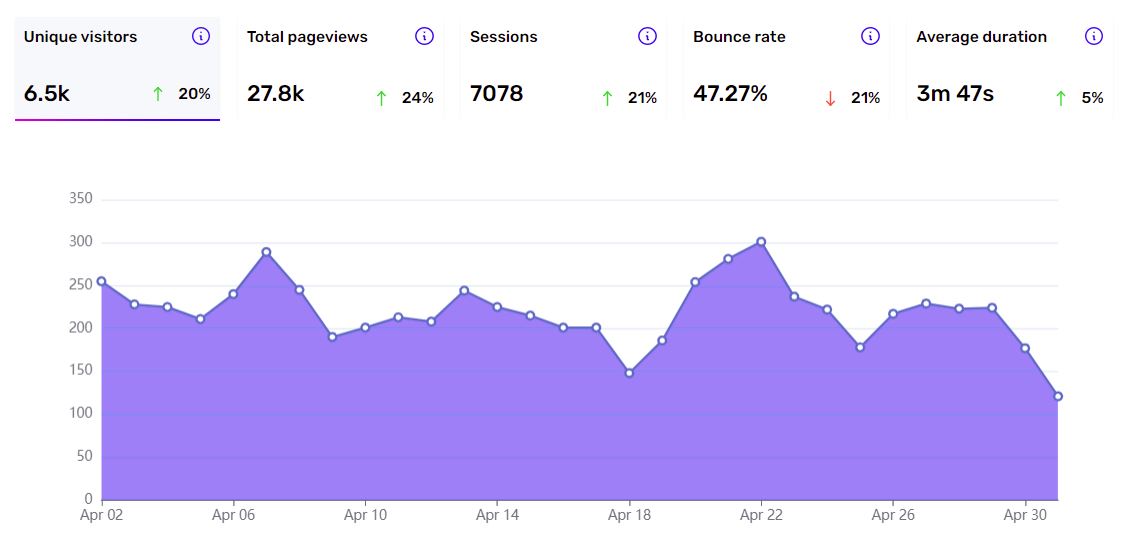
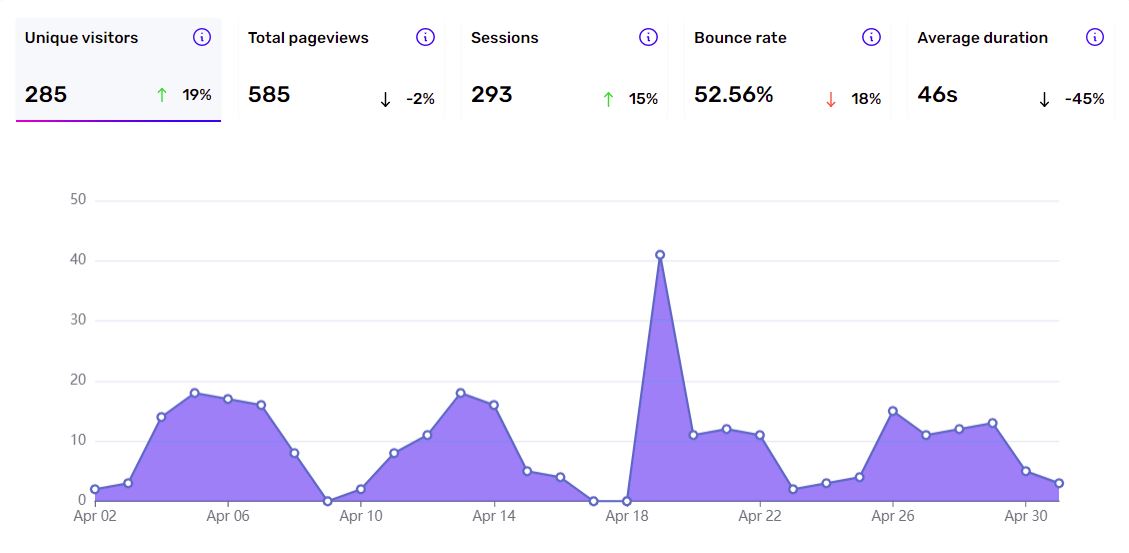
This screen displays:
- the number of unique visitors,
- the pages visited,
- sessions,
- bounce rate
- average visit duration.
For these metrics there is always a percentage comparison to the previous period available, so you can make appropriate assessments of trends.
In the upper right corner you have the option to choose the time interval you want to analyze, from the defaults up to the custom time interval.
By default the interval is set to last 30 days. By clicking on the number of " current visitors " (defined as those who have visited the site in the last 5 minutes) or by selecting Real Time from the options in the upper right, you can see what is happening in real-time on your site.
Unique Visitors
It represents the total of all unique visitors who have entered your website. Because Vantevo does not use cookies or other types of persistent identifiers, here are some practical examples to help you understand the "Unique Visitors" metric:
- If a person visits your site from multiple devices or on multiple days, they are counted as a new visitor.
- If on the same day a user enters at 8 a.m., a session opens and their fingerprint is saved. If the same user enters at 2 p.m. on the same day, he is counted as a unique visitor, even if he entered your site on the same day, more than once.
Visited Pages
The total number of pages visited by all visitors to your website.
Sessions
The total number of unique sessions of all visitors to your website.
Some practical examples explaining the metric Sessions: if on the same day a user enters your site at 08:00, a session is opened; if the same user also enters at 14:00, a new session is opened.
The duration of a session is 30 minutes; you can change the session duration in the domain settings.
Bounce rate
Bounce Rate or Bounce Rate is a metric that indicates the percentage of visitors who leave a website (bounce away) after visiting a single page. This figure is very important for understanding how long your users stay on your site.
If you have a landing page site (just one page, like "Home Page") you might see a 100% bounce rate all the time. To manage the bounce rate for landing page type sites and really understand how long your users spend on the site, Vantevo gives you 2 options: use the events or use Manual Pageview.
Average duration
It is the average duration of visits on your website. For example, if a visitor visits two pages, the first of which is for 30 seconds, then changes pages and, after another 30 seconds, leaves your site, the length of stay on the site will be counted 30 seconds. If two users visit your site and one of them stays only 30 seconds and the other 10, the average duration will be 20 seconds.
Events Page
Events is data that lets you know the type of interactions users have with your site (e.g., clicks on a button, downloading a PDF, logging in to the site, etc.).
All sections are clickable and interactive. In addition, for each section you can view the graph with data. You can filter the dashboard by events and track additional metadata fields (key-value pairs).
The main difference from conversion goals is that you control at the code level when an event is submitted and you can attach metadata.
Total events
This metric counts the total actions performed on your website.
Total visitors
They are the total number of all unique visitors who entered your website.
Unique visitors
It’s the sum of all the unique visitors who performed an action on your website (event).
Unique events
The total number of all unique events you have set up on your website.
CR - Conversion rate
Conversion Rate (CR) is the percentage of visitors to your website who complete a desired action (a conversion) out of the total number of visitors.
The formula by which CR is calculated is: total no. of visitors who completed an action/total no. of unique visitors 100*